Remember that bike count we had five months ago? The preliminary data was released late yesterday and there was a slight increase in the number of cyclists counted from 2010 to 2011, but the data suggests a drop in women riders.
This year, the count expanded to 119 locations throughout the region, but most of the analysis compares locations that were counted multiple years.
There were 71 locations that were counted in both 2010 and 2011. At those 71 locations, counters saw a 450-cyclist increase from 2010. Check out the table below to see the differences between this year and last.

The biggest changes were a 16 percent decrease in women riders counted and a 19.5 percent decrease in wrong-way riding.
Another important data set is the number of cyclists counted at “core locations.” Core locations are the 37 counting locations that have been counted for each of the four bike counts.
This year the numbers have increased very slightly, but are still below the 2008 bicycle count. Check out the table:
The increase represents a 1.1 percent increase over 2010.
Check out the maps for the top 10 weekday locations below
View 2011 Bike Count: Top locations in a larger map
Check out the top 5 weekend locations below:
View 2011 Top weekend count locatins in a larger map
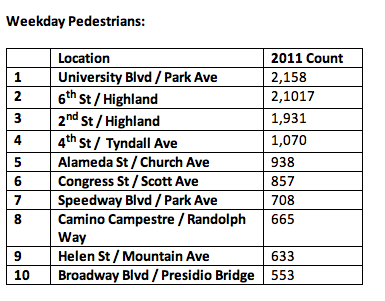
Pedestrians were also counted in 2011. Here are the numbers for walkers:
PAG is currently working on a more thorough report with count data for every location counted. We’ll have another post when the data is available.


How do these numbers relate to the census-based numbers from a few monthe ago?
Although commuters do go through campus, 8 of the top 10 counts are very much related to the student population and they boost the numbers, but do they really help in determining overall city bike needs?
How many ‘locals’ do we have riding and how are those numbers trending, if we can even find that out.