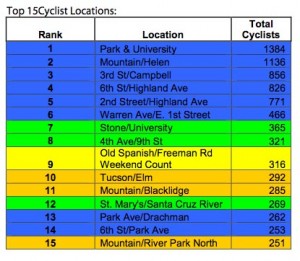
 Update: According to Ann Chanecka, who is a planner for the Pima Association of Governments, due to an error in the spreadsheet she inherited, the bike count numbers were not accurate in the report released last week. She is working on correcting the error and will send out new numbers soon.
According to Chanecka, the error over inflated the number and we will see a drop in the number of riders from 2008.
I just got an email from Ann Chanecka, who is a planner for the Pima Association of Governments and was in charge of the 2009 bike count. She included a brief report and a spreadsheet sorted by the highest bike count locations. Download the PDF. She is working on a more detailed report, but wanted to get the numbers out.
According the report:
- 12, 756 cyclists were recorded at 99 different locations around the city.
- 79.2 % of riders were men.
- 51.57% of the riders were observed in the morning.
- Riders aged 18-65 years old (estimated) made up 95.2% of the total number.
- 33.1% were wearing helmets.
- 3.3% were riding the wrong way.
- 6.3% were riding on the sidewalk.
The report also compares the 2008 numbers to the 2009 numbers, but only in the 43 locations that were counted both years.
In 2008 8,108 cyclists were counted at 43 locations. In 2009, 7,962 cyclists were counted at the same locations, which is a decrease of 146 cyclists or 1.8 percent.
The first day of the count, Tuesday Oct. 27th had normal weather for Tucson for late October, However, a cold front came through that night and temeratures dipped to 35 degrees in the morning wwhich broke record lows for the next two days of the count. The record lows likely affected the data for this annual count.
According to historical weather data, the average low for those days in October is 54 degrees.
In a phone conversation, Chanecka said they do have some data that suggests the weather may have affected the count by as much as 19 percent.
They compared the counts from Tuesday, Oct. 27 and Thursday, Oct. 29 at Park and University, which was the most trafficked intersection. There were 19 percent more riders that came through that intersection on the pleasant morning than the much colder morning.
According to Chanecka, there were two other sample locations that were recounted on warmer days, which showed jumps of 25 and 50 percent, but she said felt more comfortable with the Park and University count because it had the highest sample size.
Other interesting comparisons between 2008 and 2009:
- Female riders decreased by 5.06%
- Helmet use decreased by 14.62%
- Wrong way riding decreased by 1.59%
- Side walk riding decreased by 2.81%

The study has value in that it confirms what is intuitive and generally accepted by planners: when it comes to cycling, usage is highest in densely populated areas that have relatively low incomes and rate relatively high on resident turnover. This finding pretty much holds true when it comes to mass transit/public transit (the bus, light rail). It’s a pretty robust and stable conclusion. Citing the study, the zip codes 85719 and 85705 would seem to be where the demand is, in the context of getting the most bang for the public buck, so to speak. One could parse the data further by census block, but there’s really no point.
Anyway, it seems “hard” (hard as in fairly costly and disruptive activities that involve building things) infrastructure improvements such as those described here:
http://dot.ci.tucson.az.us/traffic3/tspedestrian.php
should be placed in 85705 and 85719 zip codes or something matching up with “Top15 Cyclist Locations.”
Perhaps future studies will put less emphasis on duh macro things that transpo planners have long known and focus instead on where, precisely, to put them…
Yes, of course, there is the adverse economic and fiscal environment at play.